The concept of churn in business has origins in the dairy industry, where churning refers to the process of separating cream from milk by continuous movement and agitation. In a business context, the term has been used for decades in industries such as telecom, subscription media, and utilities, as it metaphorically represents the constant movement of customers in and out of a service base. It grew in importance with the rise of the digital era and the emergence of mobile networks and software-as-a-service (SaaS) companies.
The subscription-based business model of SaaS and online services, combined with the ease of switching providers, makes churn a critical metric for forecasting revenue and planning for long-term growth. Churn rate (also called attrition rate, customer turnover, or customer defection) measures the proportion of customers that stop using a company’s product or service over a specified period. It is now a standard KPI for digital products and service providers.
Churn is often treated as a single metric, but it is really a composite of multiple distinct measures. It is a complex, multi-causal event that cannot be captured by one number. So, when a stakeholder asks, “Are we churning?” The answer usually is it depends on how you define churn and what kind of decision you are trying to make.
In this post, I answer a stakeholder question using a SaaS subscription dataset (RavenStack). Using SQL, I calculate three definitions of churn and place them side by side into a monthly scoreboard to show that losing customers and maintaining, or even growing revenue, are not mutually exclusive.
The question
A stakeholder asks:
“We lost customers last month, but Finance says revenue is fine. Are we actually churning, or are we upgrading into a healthier base?”
To answer that, we need to define churn in a way that matches the question, then measure each version explicitly and compare them month by month.
What we actually know
Initially, we only know:
- We “lost customers” last month (someone is seeing customer churn)
- Finance says, “revenue is fine” (someone is seeing stable or growing revenue)
- There is a hypothesis that we might be “upgrading into a healthier base.”
Before I calculate any churn metrics, I want to confirm the dataset can support three questions:
- Can I reliably answer, “Which accounts were paying at month end?”
- Can I reliably explain monthly recurring revenue (MRR) changes as a month-over-month story?
- Do we have product usage data to test whether the base is actually getting healthier?
Definitions and timelines
A churn conversation typically breaks down when stakeholders focus on different aspects of the issue. Most often, the problem stems from a misalignment with definitions and timelines.
In this walkthrough, “churn” has three separate meanings:
- Logo churn: customers who were paying last month, but are not paying this month
- Revenue churn/retention: how MRR changed among existing customers
- Activity churn: paying customers who were active last month, but are inactive this month
Month-end snapshot
All three definitions depend on one consistent monthly snapshot. The dataset contains accounts that can have overlapping subscriptions. To handle this, I enforce two month-end snapshot rules to ensure a single subscription is selected for each account in a given month:
- Month-end rule: a subscription counts for a month only if it is active as of the last day of the month.
- One-row rule: keep one row per (
account_id,month_start) using the most recent subscription in that month.
This “tie-break” logic happens in v_account_mrr_month.
ROW_NUMBER() OVER (
    PARTITION BY month_start, account_id
    ORDER BY start_date DESC, mrr_amount DESC, subscription_id DESC
) AS rnThis prevents double-counting and makes month-over-month comparisons stable. Additionally, since month-end snapshots only include accounts that are paying at month close, non-paying months are omitted. To keep month-to-month comparisons honest, I build an account-month “spine” (every account crossed with every month) and fill missing months with zeros, so LAG() truly compares adjacent calendar months.
A simple place to start in SQL
I start by building the month-end snapshot view of every paying account, which serves as the baseline that every churn calculation relies on.
The goal here is to have one row for each account per month, tied to the month’s close. This means:
- A subscription only counts if it is active as of the last day of the month
- If an account has overlapping subscriptions at month end, the most recent subscription wins
CREATE OR REPLACE VIEW v_account_mrr_month AS
WITH bounds AS (
SELECT
DATE_TRUNC('month', MIN(start_date))::date AS min_month,
DATE_TRUNC('month', MAX(COALESCE(end_date, start_date)))::date AS max_month
FROM subscriptions
),
months AS (
SELECT
GENERATE_SERIES(min_month, max_month, interval '1 month')::date AS month_start,
(GENERATE_SERIES(min_month, max_month, interval '1 month')
+ interval '1 month' - interval '1 day')::date AS month_end
FROM bounds
),
subs_at_eom AS (
SELECT
m.month_start,
m.month_end,
s.account_id,
s.subscription_id,
s.plan_tier,
s.seats,
COALESCE(s.mrr_amount, 0)::numeric(12,2) AS mrr_amount,
s.start_date,
COALESCE(s.end_date, date '9999-12-31') AS end_date
FROM months m
JOIN subscriptions s
ON s.start_date <= m.month_end
AND COALESCE(s.end_date, date '9999-12-31') >= m.month_end
),
ranked AS (
SELECT
*,
ROW_NUMBER() OVER (
    PARTITION BY month_start, account_id
    ORDER BY start_date DESC, mrr_amount DESC, subscription_id DESC
) AS rn
FROM subs_at_eom
)
SELECT
month_start,
account_id,
subscription_id,
plan_tier,
seats,
mrr_amount
FROM ranked
WHERE rn = 1;This creates a clean, analyzable table: one account per row, one month, one MRR value.
Now I look for common sources of mismatch
With a consistent month-end snapshot in place, the remaining mismatches usually come from measuring different things or measuring the same thing on different timelines.
1. Different churn logic
Most stakeholders mean logo churn when they say, “we lost customers.” In 04_logo_churn.sql, logo churn is the month-over-month change in whether an account is paying:
LAG(COALESCE(am.mrr_amount, 0), 1, 0) OVER (
    PARTITION BY s.account_id
    ORDER BY s.month_start
) AS prev_mrrThen I count churned customers as accounts that were paying last month, but are not paying this month:
COUNT(*) FILTER (WHERE prev_mrr > 0 AND mrr_amount = 0) AS churned_customersFinance usually cares less about “how many” and more about “how much.” So, in 05_revenue_waterfall.sql, I build an MRR movement view that explains month-to-month revenue change as a set of components :
        SUM(prev_mrr)
            FILTER (WHERE prev_mrr > 0
            ) AS starting_mrr,
        SUM(mrr_amount)
            FILTER (WHERE prev_mrr = 0
            AND mrr_amount > 0
            ) AS new_mrr,
        SUM(mrr_amount - prev_mrr)
            FILTER (WHERE prev_mrr > 0
            AND mrr_amount > prev_mrr
            ) AS expansion_mrr,
        SUM(prev_mrr - mrr_amount)
            FILTER (WHERE prev_mrr > 0
            AND mrr_amount > 0
            AND mrr_amount < prev_mrr
            ) AS contraction_mrr,
        SUM(prev_mrr)
            FILTER (WHERE prev_mrr > 0
            AND mrr_amount = 0
            ) AS churned_mrr,
        SUM(mrr_amount)
            FILTER (WHERE mrr_amount > 0
) AS ending_mrrFrom there, I compute two retention metrics that stakeholders tend to recognize:
- gross revenue churn rate
- net revenue retention (NRR)
(COALESCE(contraction_mrr, 0) + COALESCE(churned_mrr, 0))::numeric
/ NULLIF(COALESCE(starting_mrr, 0)::numeric, 0) AS gross_revenue_churn_rate,

(COALESCE(starting_mrr, 0) + COALESCE(expansion_mrr, 0)
- COALESCE(contraction_mrr, 0) - COALESCE(churned_mrr, 0))::numeric
/ NULLIF(COALESCE(starting_mrr, 0)::numeric, 0) AS net_revenue_retentionThis is the link between losing customers and still seeing stable revenue. Logo churn can be real while new and expansion MRR offset the revenue impact. This effect can be magnified by mix shift, meaning shifts in the balance of higher or lower tier segments.
2. Timing mismatch (month close vs any in-month activity)
Even when teams agree on definitions, timing can still create disagreement. Some reporting is effectively active at any point during the month, while Finance and most month-close reporting is active as of month end.
This walkthrough uses the month-end state as the foundation, so “last month” means month close. This prevents timing mismatches where mid-month cancellations might otherwise be counted as churn in the following month.
3. “Healthier base” requires engagement, not just revenue
The stakeholder’s hypothesis is not just “revenue is fine.” It’s maybe the base is “healthier.” This is an engagement question and requires insights on product usage.
06_activity_churn.sql aggregates raw usage data to one row per one account per month and defines:
- Paying:
mrr_amount > 0 - Active:
total_usage_count > 0
Activity churn identifies accounts that were paying and active last month, and are still paying, yet inactive this month:
COUNT(*) FILTER (
    WHERE prev_is_paying = 1
    AND prev_is_active = 1
    AND is_paying = 1
    AND is_active = 0
) AS activity_churned_accountsWhat I’m trying to answer
At this point, I’m not trying to pick a single “correct” churn number. I’m trying to answer four separate questions that stakeholders often bundle into one sentence:
- Are we actually losing paying customers? (logo churn)
- Are we losing existing customer revenue? (gross revenue churn/NRR)
- If “revenue is fine,” where is it coming from? (new vs expansion, mix shift)
- Are paying customers disengaging? (activity churn, which would contradict the “healthier base” hypothesis)
To answer all of this in one place, I combine the three definitions into a monthly scoreboard.
From 07_scoreboard.sql:
CREATE OR REPLACE VIEW v_churn_scoreboard_month AS
SELECT
    l.month_start,
    l.new_customers,
    l.churned_customers,
    l.customers_end,
    l.logo_churn_rate,

    r.starting_mrr,
    r.new_mrr,
    r.expansion_mrr,
    r.contraction_mrr,
    r.churned_mrr,
    r.ending_mrr,
    r.gross_revenue_churn_rate,
    r.net_revenue_retention,

    a.paying_accounts,
    a.active_paying_accounts,
    a.inactive_but_paying_accounts,
    a.activity_churned_accounts,
    a.activity_churn_rate
FROM v_logo_churn_month l
LEFT JOIN v_revenue_waterfall_month r USING (month_start)
LEFT JOIN v_activity_churn_month a USING (month_start)
ORDER BY l.month_start;One row per month, one place to reconcile the story.
Visuals
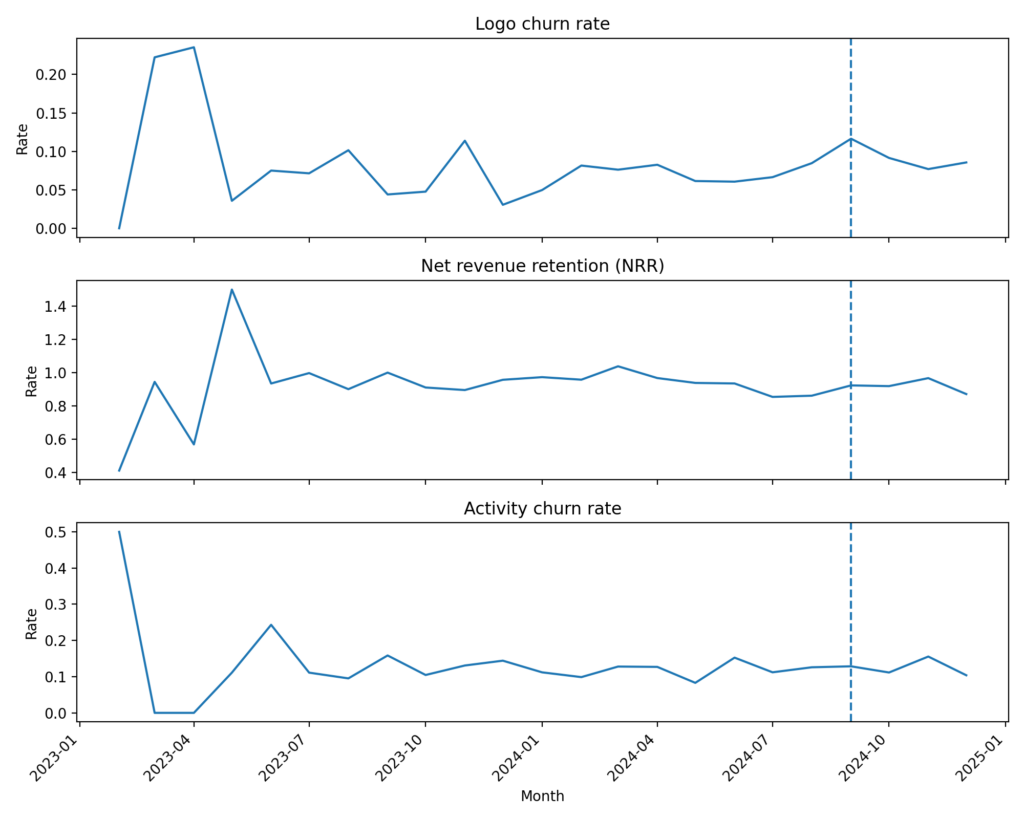
Visual 1: Scoreboard trends (month by month)
This makes it easy to see how the stakeholder’s question can be true without being contradictory. In a single view, it shows three different “churn” perspectives over time:
- Logo churn rate
- Net revenue retention (NRR)
- Activity churn rate
The three lines move differently because they are measuring different business realities. The dashed line marks the month I highlight in the rest of the post (Sep 2024).
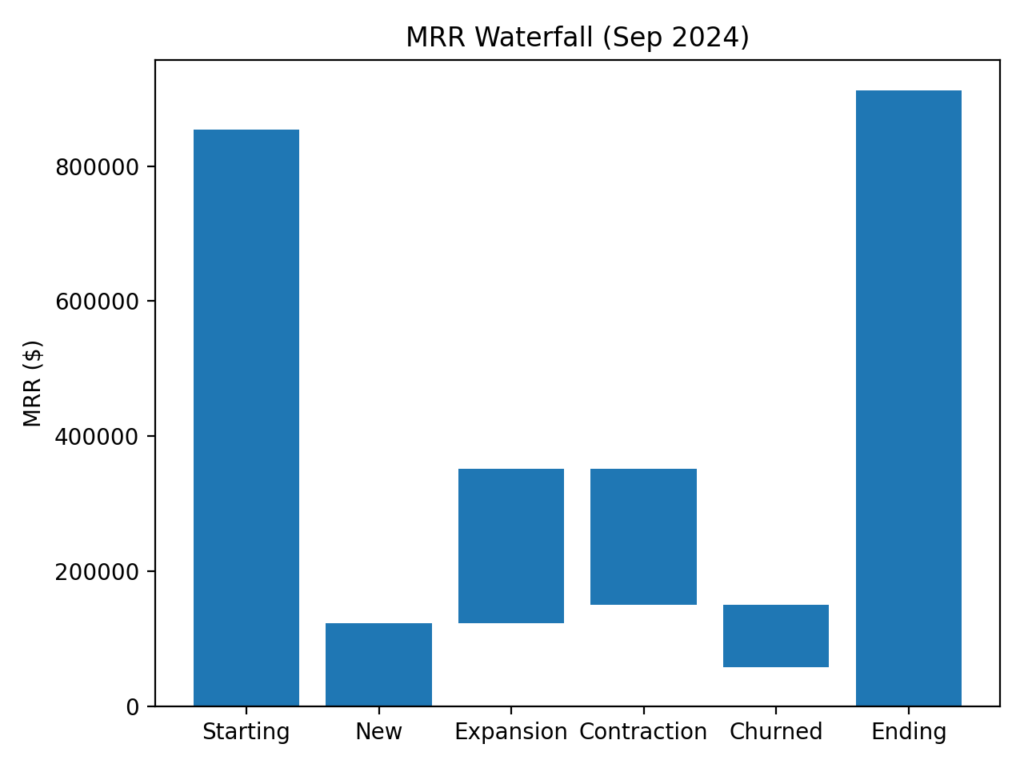
Visual 2: MRR waterfall for the highlighted month
This answers the Finance side of the question: “If we lost customers, why is revenue fine?”
It breaks down the month’s MRR change into:
- New MRR
- Expansion
- Contraction
- Churned MRR
Now, “revenue is fine” becomes something measurable by checking whether expansion and new revenue outweigh the losses.
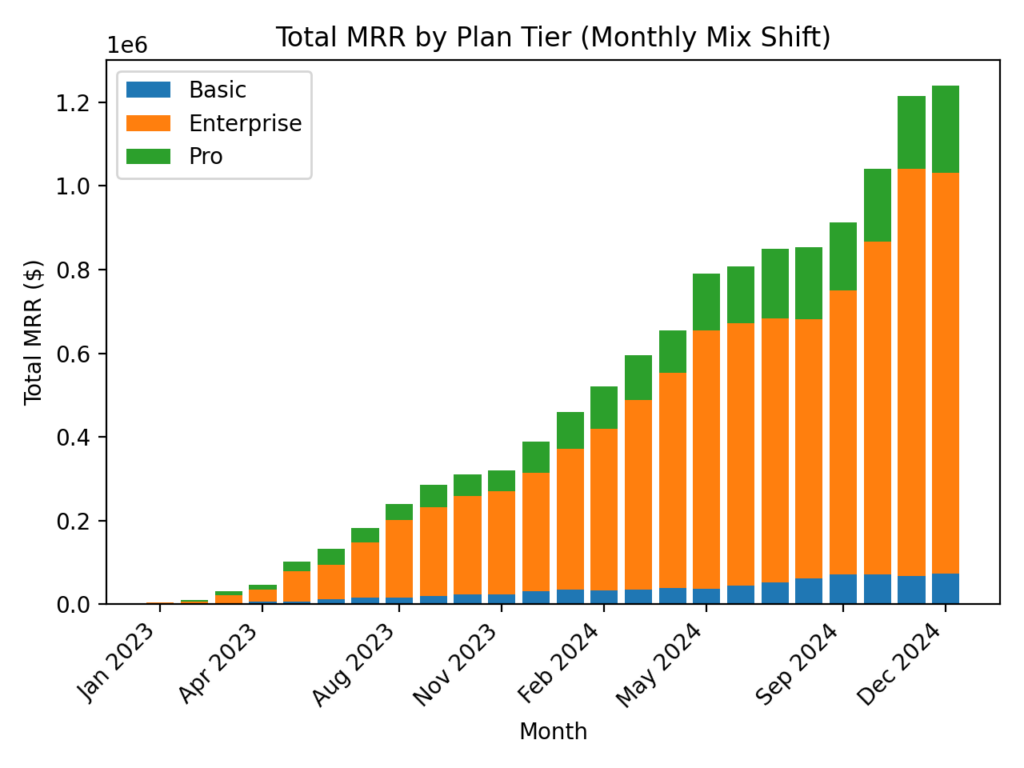
Visual 3: Total MRR mix shift by plan tier
This answers: “Are we upgrading into a healthier base, or just a higher-revenue base?”
It shows whether revenue growth is being driven by:
- A rising share of Enterprise MRR
- Concentration in higher tiers
- Shifts that can make customer counts misleading
(“Health” still needs the activity churn chart, but mix shift explains the “more revenue” part of the title.)
Sep 2024 example (combining the three perspectives)
Logo churn and net growth can both be true
In Sep 2024:
- Customers at start: 335
- Churned customers: 39 -> logo churn rate: 11.6%
- New customers: 54
- Customers at end: 350
- Net customer change: +15 -> net growth rate: 4.5%
“We churned customers” is true (gross outflow happened). “We grew” is also true (inflow exceeded outflow).
Revenue increased, even though the existing base retained less than 100%
In Sep 2024 MRR:
- Starting MRR: $854,131
- New MRR: +$122,497
- Expansion MRR: +$229,455
- Contraction MRR: -$201,852
- Churned MRR: -$92,277
- Ending MRR: $911,954 (+$57,823)
NRR was 92.4%, which reflects a net reduction within the existing base. Total MRR still rose because new and expansion offset contraction and churn.
“Healthier base” needs usage evidence
In Sep 2024 usage:
- Paying accounts: 350
- Active paying accounts: 296
- Inactive-but-paying: 54 (15.4% of paying)
- Activity churned accounts: 36
- Activity churn rate: 12.9%
Revenue growth and churn can coexist with meaningful engagement risk.
What I’d tell the stakeholder
I would tell the stakeholder both observations can be true because they are looking at different definitions of “churn,” and each definition answers a different question.
1. Are we actually churning?
Yes, if you mean logo churn. We did lose paying customers last month. The logo churn rate is measuring accounts that were paying last month but are no longer paying this month. So, the statement “we lost customers” is true, even if the total number of customers increases because new customers exceed churn.
In Sep 2024, we churned 39 paying customers, an 11.6% logo churn rate on a starting base of 335.
2. Why does Finance say revenue is fine?
Because revenue is not determined by the number of customers alone. Finance is looking at MRR movement, which breaks down into:
- New MRR (new customers that started paying)
- Expansion MRR (existing customers upgrading to higher tiers)
- Contraction MRR (existing customers downgrading to lower tiers)
- Churned MRR (revenue lost from customers that left)
When new + expansion is larger than contraction + churned, ending MRR can grow even as we lose customers. This is how “we lost customers” and “revenue is fine” can be true at the same time.
In Sep 2024, starting MRR was $854,131 and ending MRR was $911,954 (up $57,823) because $351,952 of new and expansion outweighed $294,129 of contraction and churned MRR. NRR was 92.4%, so the existing base shrank net even though total MRR rose.
3. Are we upgrading to a healthier base?
Maybe, but “healthier” speaks to engagement, not revenue. To assess “health,” activity churn needs to be analyzed:
- Customers who were active last month
- Who are still paying this month
- But who went inactive this month (no usage)
If inactive-but-paying and activity churn are elevated, it indicates risk within the base, even if revenue looks steady.
In Sep 2024, 54 of 350 paying accounts were inactive-but-paying and 36 accounts activity-churned, for an activity churn rate of 12.9%. This suggests risk building inside the base.
4. Actionable summary
We are churning customers, but revenue is being offset by new customer additions, expansions, and changes in mix. We need usage data to confirm the “healthier base” hypothesis and activity churn helps reveal underlying risk.
5. What I recommend we track going forward
To avoid confusion going forward, these three metrics should be reported together each month:
- Logo churn rate (customer count view)
- NRR + gross revenue churn (Finance view)
- Inactive-but-paying + activity churn (product risk view)
This provides a single, consistent measure of churn to eliminate confusion over which number to use.
What I’d watch next
- If logo churn increases, but NRR remains stable, the losses are being offset elsewhere. Segment the churned logos by size or tier, and check whether revenue expansion is concentrated among specific accounts.
- If NRR declines while MRR increases, new revenue may be hiding underlying weakness. Monitor cohort retention.
- If activity churn increases, consider it a leading indicator of potential risk. Identify accounts that are still paying, but no longer active. Pinpoint which features they’ve stopped using.
The takeaway
When someone says, “churn is up,” the next question should be: logo churn, revenue churn, or activity churn?
Logo churn, revenue churn, and activity churn can all move differently in the same month. Each of them reveals different insights. Comparing them side by side helps teams stay aligned. The scoreboard reflects overall performance better than a single churn measure.
Full walkthrough on GitHub
If you want to follow along exactly, I’ve published the full walkthrough on GitHub, including:
- SQL pipeline (snapshot -> churn definitions -> scoreboard -> checks)
- Extract query for Python visuals (
10_extracts_for_python.sql) - Notebook that generates the figures (
01_visuals.ipynb)
You can find it here: sql-churn-analysis